

Automated Weekly Google Ads Week-over-Week Performance Comparison
How two Make scenarios turn raw campaign data into a Google Sheet and a plain-English weekly summary
Every Monday used to start the same way: open Google Ads, filter the campaigns, copy the numbers into a spreadsheet, then try to remember what last week looked like. It was slow, easy to get wrong, and the "so what?" never made it into the report.
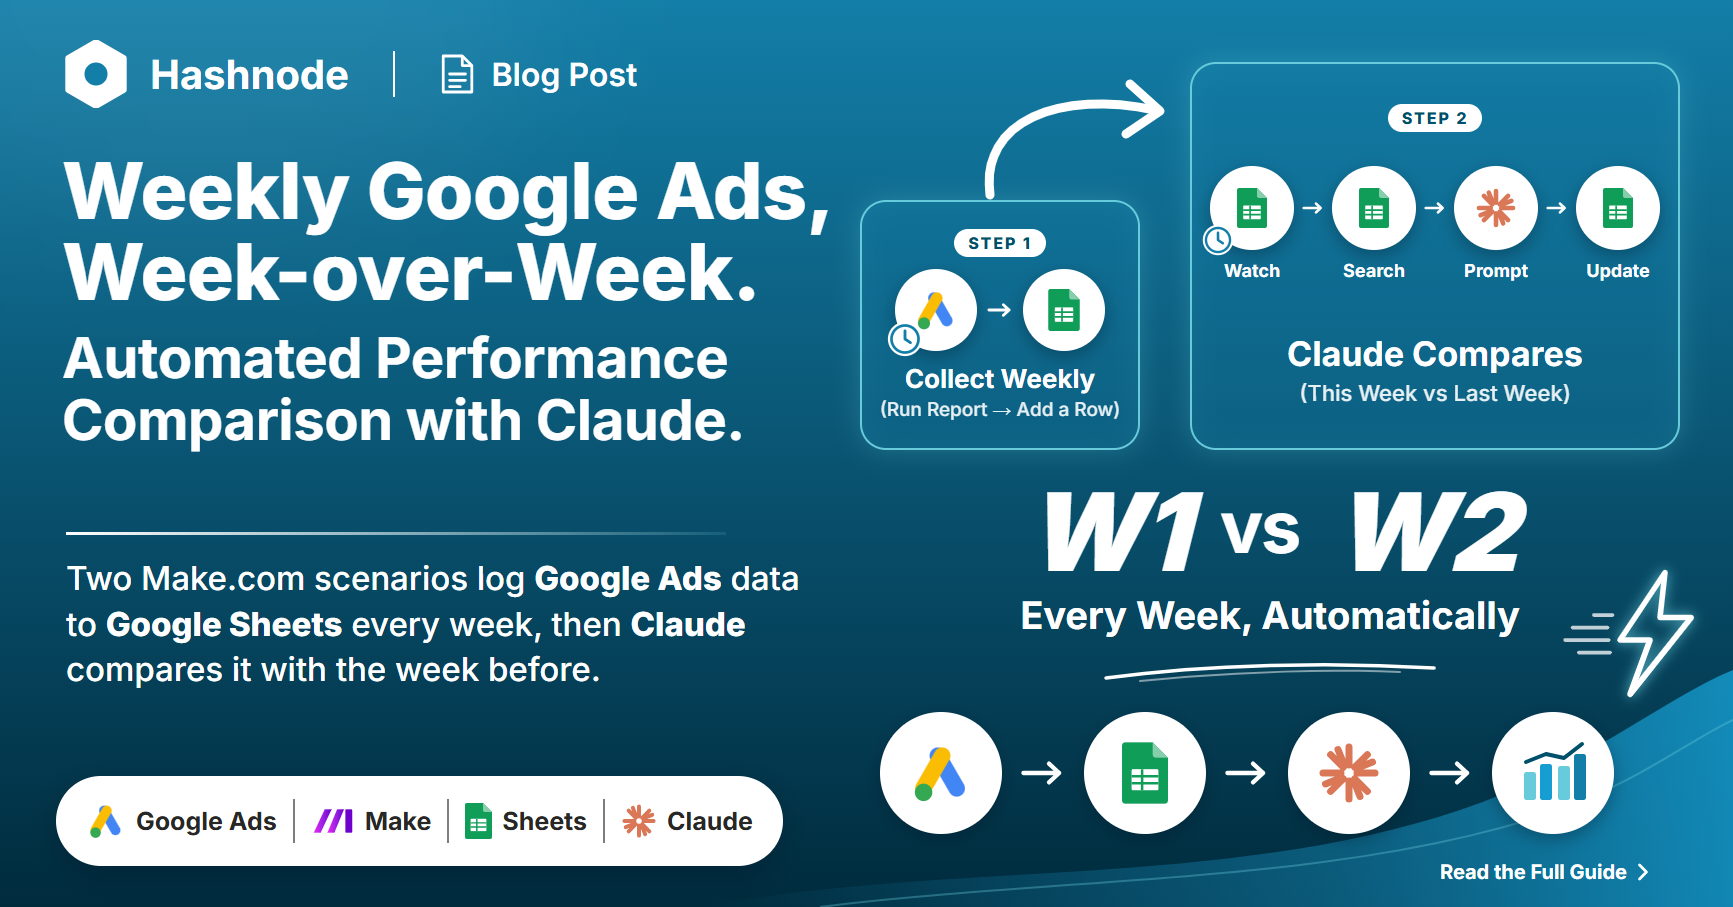
So we automated it. Two Make.com scenarios now do the whole job:
- Step 1 pulls last week's Google Ads data and appends it to a Google Sheet.
- Step 2 compares each campaign with the week before and writes a short AI summary with one insight and one recommendation.
Here is how it works, and the mistakes we hit along the way.
The goal
Our campaigns are used for lead generation, so the report tracks what matters for leads, not just traffic:
| Column | What it tells us |
|---|---|
| Week | Monday date of the reporting week |
| Campaign | Campaign name |
| Imp | Impressions |
| CTR | Click-through rate |
| Clicks | Clicks |
| Conversions | Leads |
| Conv. rate | Conversion rate |
| Cost | Spend |
| Cost / conv. | Cost per lead |
| Avg. CPC | Average cost per click |
One row per campaign per week, appended every time so the sheet becomes a running history.
Step 1: Google Ads to Google Sheets
The first scenario has three modules.
1. Google Ads Reports: Run a Custom Report. This module runs a GAQL query against the ad account. The query asks only for the fields we need, limits the date range to last Monday through Sunday, and filters to the campaigns we care about:
SELECT campaign.name, campaign.status, metrics.impressions, metrics.ctr,
       metrics.clicks, metrics.conversions,
       metrics.conversions_from_interactions_rate, metrics.cost_micros,
       metrics.average_cpc
FROM campaign
WHERE segments.date BETWEEN '{{start_date}}' AND '{{end_date}}'
  AND campaign.status NOT IN ('REMOVED', 'PAUSED')
  AND campaign.name LIKE 'CM%'
ORDER BY metrics.cost_micros DESC
The {{start_date}} and {{end_date}} placeholders are Make formulas that work out last Monday and last Sunday from today's date, so the scenario never needs editing:
{{formatDate(addDays(now; 0 - formatDate(now; "E") - 6); "YYYY-MM-DD")}}
{{formatDate(addDays(now; 0 - formatDate(now; "E")); "YYYY-MM-DD")}}
2. Array aggregator. The Google Ads module returns one bundle per campaign. Writing each bundle to the sheet separately would burn operations, so an aggregator collects them into one array first. This is also what Make recommends in the module itself.
3. Google Sheets: Add Multiple Rows. All campaigns are written in a single operation, with the aggregator's array mapped to the sheet columns.
Formulas that matter
Google Ads reports money in micros (1,000,000 micros = 1 currency unit), so cost and CPC need converting. Cost per lead is calculated ourselves rather than read from the API:
Cost:         {{round(ifempty(metrics_costMicros; 0) / 1000000; 2)}}
Cost / conv.: {{if(metrics_conversions > 0; round(metrics_costMicros / 1000000 / metrics_conversions; 2); 0)}}
Avg. CPC:     {{round(ifempty(metrics_averageCpc; 0) / 1000000; 2)}}
Step 2: AI summary with Claude
The second scenario turns the sheet into something a person can read in ten seconds.
- Google Sheets: Watch New Rows fires for each new row Step 1 adds.
- Google Sheets: Search Rows looks up the same campaign for the previous week. It filters on the campaign name and on the Week value minus 7 days.
- Anthropic Claude: Create a Prompt receives this week's numbers and last week's numbers.
- Google Sheets: Update a Row writes Claude's answer back next to the data.
The prompt does most of the work. We tell Claude the campaigns are lead generation, so it should judge them on conversions, conversion rate and cost per lead, and we give it a strict output format:
Summary: 2 sentences comparing this week to last week, with the % change
         for conversions, cost and cost / conv.
Insight: one key insight explaining WHY performance changed.
Recommendation: one specific action to take next week.
We also added rules: do not invent data, say so when there were no conversions instead of treating zero cost per lead as good, handle campaigns with no previous week, and keep the answer under 80 words.
Problems we hit (and the fixes)
The aggregator complained about "duplicate labels". Aggregating the raw campaign and metrics objects made Make see several fields called metrics. The fix was to set the aggregator's target to the Google Sheets module and map each sheet column explicitly.
Cost per conversion was missing. metrics.cost_per_conversion is a valid field, but Google Ads leaves it out when a campaign has zero conversions. Calculating cost divided by conversions ourselves is more reliable.
Avg. CPC showed NaN. Campaigns with no clicks return no average CPC, and dividing an empty value gives NaN. Wrapping it in ifempty(...; 0) fixed it.
Last week's row was never found. Our sheet stores dates like 10/5/2026, but the lookup was building 2026-10-05, so the text filter matched nothing. Both the parse and the format strings had to use M/D/YYYY. If you work with dates in a sheet, check the exact text format Make sees.
What we would do next
- Combine all campaigns into one summary email or Slack message instead of one note per campaign.
- Add alerts when cost per lead rises more than a set percentage.
- Chart the sheet in Looker Studio for a monthly view.
Wrapping up
Two scenarios, one Google Sheet and a short prompt replaced a manual Monday routine. The data is consistent, history builds up automatically, and the AI summary turns the numbers into a decision. If you run lead-generation campaigns, the same approach works with any account: change the GAQL filter, point the sheet at your own columns, and tune the prompt to your goals.
About the author
- A Freelance Dashboard Developer
Comments
Join the discussionNo comments yet. Be the first to comment.