
Pulling PostHog Data into Looker Studio with BigQuery
What failed, what worked, and the SQL views behind a full web analytics dashboard
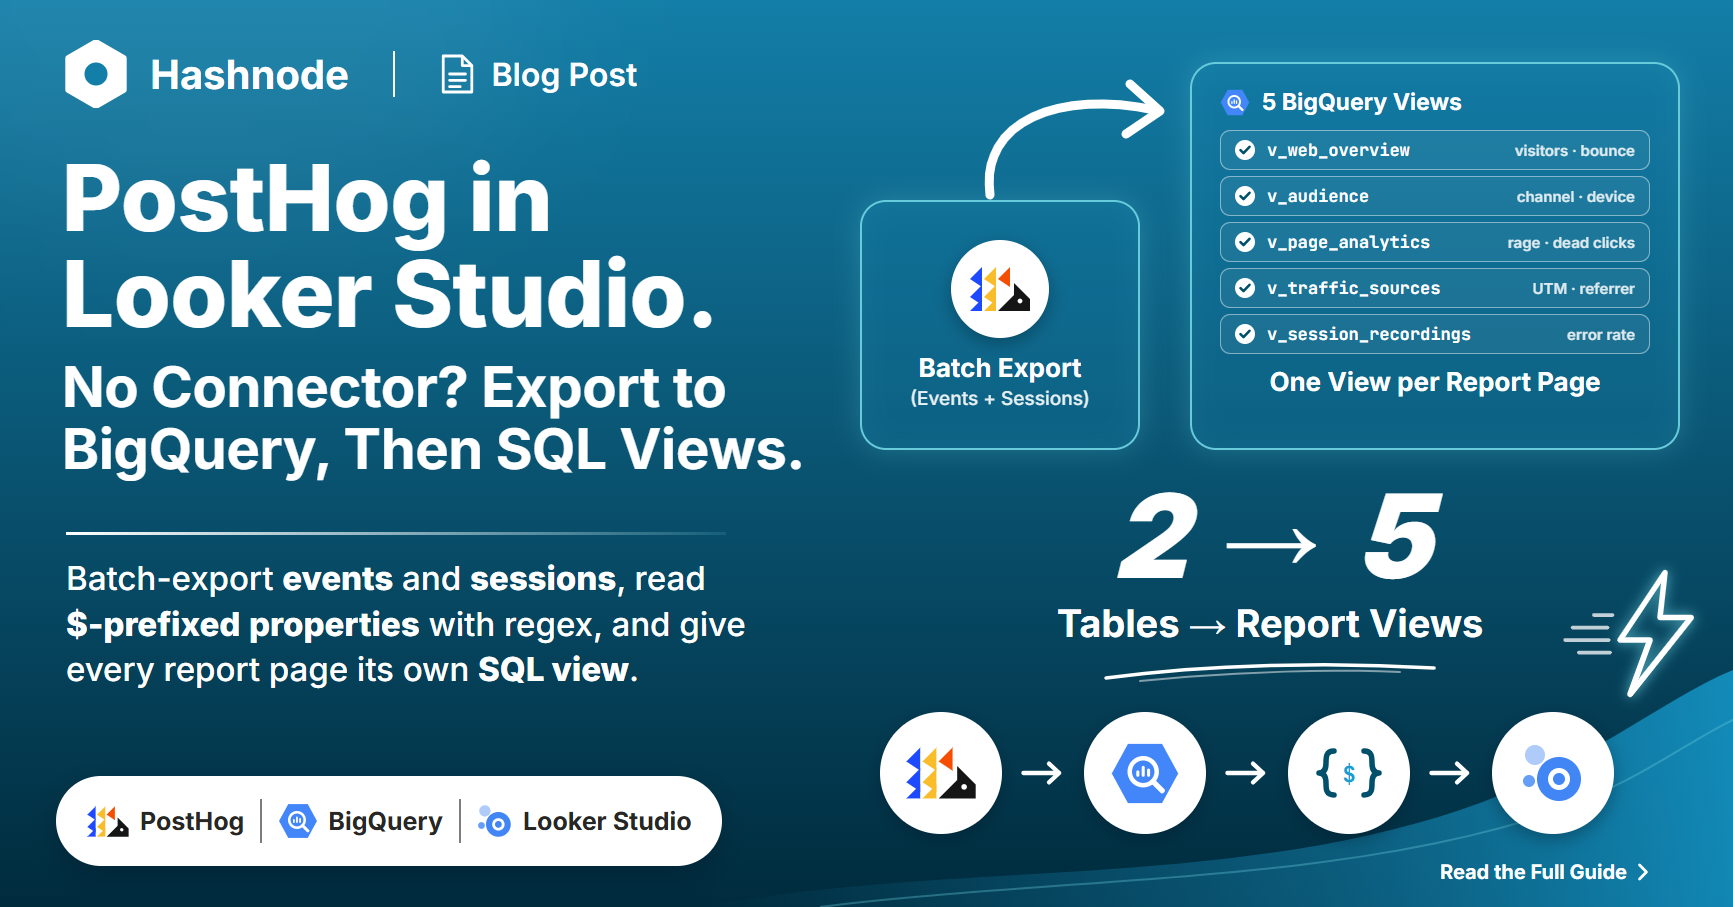
I wanted a simple thing: take the dimensions and metrics I already track in PostHog (visitors, sessions, bounce rate, channel type, device type, conversions, rage clicks, dead clicks, errors) and build a proper report in Looker Studio (formerly Data Studio).
PostHog has no native Looker Studio connector, so my first instinct was to try the no-code connectors. That turned out to be a dead end. This post walks through what failed, what worked, and the exact SQL I ended up using, including the errors I hit along the way so you can skip them.
The metrics I wanted
Here is the list I started with, grouped the way I planned to build the dashboard:
| Group | Metrics / dimensions |
|---|---|
| Web overview | Visitors, Page views, Sessions, Session duration, Bounce rate |
| Audience | Unique visitors, Channel type, Device type |
| Session replay | Person, Activity, Duration, Recording |
| Conversions | Actions, Converting users, Conversions, CR |
| UX health | URL, Path, Rage clicks, Dead clicks, Errors |
Attempt 1: No-code connectors (Windsor.ai and Coupler.io)
I connected Windsor.ai first. The fields it exposed looked like this: annotations.*, cohorts.*, feature_flags.*, insights.*, persons.*, projects.*, and a handful of generic fields such as Clicks, Impressions and Revenue.
Coupler.io showed the same list of objects: Projects, Cohorts, Feature flags, Persons, Events, Annotations and Insights.
The problem is that these connectors pull PostHog's object tables (the metadata about your project) and raw event rows. They do not give you aggregated web analytics like sessions, bounce rate or session duration. You would have to compute everything yourself downstream, which defeats the purpose of a connector.
Attempt 2: PostHog batch exports to BigQuery
PostHog can export data to BigQuery natively through Data pipelines → Destinations → BigQuery. You can export different models, and two of them are exactly what a web analytics report needs:
- Events: one row per event, with a
propertiescolumn holding everything else (URL, device, browser, geo, session ID and so on). - Sessions: one pre-aggregated row per session.
I exported both. The sessions table is the real time saver, because PostHog has already calculated several things for you:
| What you need | Sessions table column |
|---|---|
| Session ID | session_id |
| Visitor | distinct_id |
| Duration | session_duration |
| Bounce flag | is_bounce |
| Channel type | channel_type |
| Entry / exit page | entry_current_url, entry_pathname, exit_current_url |
| UTM data | entry_utm_source, entry_utm_medium, entry_utm_campaign |
| Referrer | entry_referring_domain |
The events table fills the gaps: page views, device type, browser, OS, rage clicks, dead clicks, exceptions and geo data all live there.
Once both tables landed in BigQuery, Looker Studio could connect to them with its built-in BigQuery connector for free.
The architecture
PostHog  →  Batch export (events + sessions)  →  BigQuery tables
                                                      ↓
                                              SQL views (one per report page)
                                                      ↓
                                                Looker Studio
Instead of pointing Looker Studio at the raw tables, I created BigQuery views, one per dashboard page. A view is just a saved query, so it always reads the latest data from the base tables. Looker Studio then gets clean, pre-shaped fields.
Gotcha 1: the timestamp conversion error
My first draft converted timestamps as if they were numbers:
DATE(TIMESTAMP_SECONDS(CAST(start_timestamp * 86400 + 2209161600 AS INT64)))
BigQuery replied with:
No matching signature for operator * Argument types: TIMESTAMP, INT64
The cause was simple: start_timestamp is already a TIMESTAMP. The fix is just:
DATE(start_timestamp)
Check your column types in the Schema tab before writing any conversion.
Gotcha 2: PostHog property names start with $
PostHog stores properties like $device_type, $browser and $current_url as JSON keys that begin with a dollar sign. That collides with JSONPath syntax. All of these failed with Invalid token in JSONPath:
JSON_EXTRACT_SCALAR(properties, '$.$device_type')
JSON_EXTRACT_SCALAR(properties, "$.\"$device_type\"")
JSON_VALUE(properties, '$["$device_type"]')
What finally worked was skipping JSONPath altogether and using a regular expression:
REGEXP_EXTRACT(properties, r'"\$device_type"\s*:\s*"([^"]+)"') AS device_type
How that expression works
| Piece | Meaning |
|---|---|
r'...' |
Raw string, so backslashes are taken literally |
"\$device_type" |
The key, with the $ escaped because it is special in regex |
\s*:\s* |
A colon with optional spaces around it |
" |
Opening quote of the value |
([^"]+) |
Capture group: one or more characters that are not a quote. This is what gets returned |
" |
Closing quote of the value |
Given {"$device_type": "Desktop", "$browser": "Chrome"}, the capture group returns Desktop. To extract another property, only the key name changes:
REGEXP_EXTRACT(properties, r'"\$browser"\s*:\s*"([^"]+)"')
REGEXP_EXTRACT(properties, r'"\$os"\s*:\s*"([^"]+)"')
REGEXP_EXTRACT(properties, r'"\$pathname"\s*:\s*"([^"]+)"')
Caveat: this pattern expects the value to be a quoted string. For numeric values such as latitude and longitude, drop the quotes around the capture group:
r'"\$geoip_latitude"\s*:\s*([0-9.\-]+)'.
A related mistake I made: wrapping REGEXP_EXTRACT inside JSON_EXTRACT_SCALAR. Do not do that. REGEXP_EXTRACT already returns a plain string, so there is nothing left to parse as JSON.
The views
Replace YOUR_PROJECT, YOUR_DATASET, and the table names with your own.
View 1: Web overview
Visitors, page views, sessions, average duration, bounce rate.
CREATE OR REPLACE VIEW `YOUR_PROJECT.YOUR_DATASET.v_web_overview` AS

WITH sessions AS (
  SELECT
    DATE(start_timestamp)                 AS date,
    COUNT(DISTINCT session_id)            AS sessions,
    COUNT(DISTINCT distinct_id)           AS unique_visitors,
    AVG(session_duration)                 AS avg_session_duration_seconds,
    COUNTIF(is_bounce = 1) / COUNT(*)     AS bounce_rate
  FROM `YOUR_PROJECT.YOUR_DATASET.sessions_table`
  WHERE session_id IS NOT NULL
  GROUP BY date
),

pageviews AS (
  SELECT
    DATE(timestamp)                       AS date,
    COUNT(*)                              AS pageviews,
    COUNT(DISTINCT distinct_id)           AS visitors
  FROM `YOUR_PROJECT.YOUR_DATASET.events_table`
  WHERE event = '$pageview'
  GROUP BY date
)

SELECT
  COALESCE(s.date, p.date)                 AS date,
  p.visitors                               AS visitors,
  p.pageviews                              AS page_views,
  s.sessions                               AS sessions,
  ROUND(s.avg_session_duration_seconds, 1) AS avg_session_duration_seconds,
  ROUND(s.bounce_rate * 100, 2)            AS bounce_rate_pct,
  s.unique_visitors                        AS unique_visitors
FROM sessions s
FULL OUTER JOIN pageviews p ON s.date = p.date;
View 2: Audience (channel and device)
CREATE OR REPLACE VIEW `YOUR_PROJECT.YOUR_DATASET.v_audience` AS

SELECT
  DATE(s.start_timestamp)                                           AS date,
  s.channel_type,
  REGEXP_EXTRACT(e.properties, r'"\$device_type"\s*:\s*"([^"]+)"')  AS device_type,
  REGEXP_EXTRACT(e.properties, r'"\$browser"\s*:\s*"([^"]+)"')      AS browser,
  REGEXP_EXTRACT(e.properties, r'"\$os"\s*:\s*"([^"]+)"')           AS operating_system,
  COUNT(DISTINCT s.session_id)                                      AS sessions,
  COUNT(DISTINCT s.distinct_id)                                     AS users
FROM `YOUR_PROJECT.YOUR_DATASET.sessions_table` s
LEFT JOIN (
  SELECT DISTINCT
    REGEXP_EXTRACT(properties, r'"\$session_id"\s*:\s*"([^"]+)"')   AS session_id,
    properties
  FROM `YOUR_PROJECT.YOUR_DATASET.events_table`
  WHERE REGEXP_EXTRACT(properties, r'"\$device_type"\s*:\s*"([^"]+)"') IS NOT NULL
) e ON s.session_id = e.session_id
GROUP BY date, channel_type, device_type, browser, operating_system;
View 3: Page analytics (rage clicks, dead clicks, errors)
CREATE OR REPLACE VIEW `YOUR_PROJECT.YOUR_DATASET.v_page_analytics` AS

WITH pageviews AS (
  SELECT
    DATE(timestamp) AS date,
    REGEXP_EXTRACT(properties, r'"\$current_url"\s*:\s*"([^"]+)"') AS url,
    REGEXP_EXTRACT(properties, r'"\$pathname"\s*:\s*"([^"]+)"')    AS path,
    COUNT(*) AS pageviews,
    COUNT(DISTINCT distinct_id) AS unique_visitors
  FROM `YOUR_PROJECT.YOUR_DATASET.events_table`
  WHERE event = '$pageview'
  GROUP BY date, url, path
),

rage_clicks AS (
  SELECT
    DATE(timestamp) AS date,
    REGEXP_EXTRACT(properties, r'"\$pathname"\s*:\s*"([^"]+)"') AS path,
    COUNT(*) AS rage_clicks
  FROM `YOUR_PROJECT.YOUR_DATASET.events_table`
  WHERE event = '$rageclick'
  GROUP BY date, path
),

dead_clicks AS (
  SELECT
    DATE(timestamp) AS date,
    REGEXP_EXTRACT(properties, r'"\$pathname"\s*:\s*"([^"]+)"') AS path,
    COUNT(*) AS dead_clicks
  FROM `YOUR_PROJECT.YOUR_DATASET.events_table`
  WHERE event = '$dead_click'
  GROUP BY date, path
),

errors AS (
  SELECT
    DATE(timestamp) AS date,
    REGEXP_EXTRACT(properties, r'"\$pathname"\s*:\s*"([^"]+)"') AS path,
    COUNT(*) AS errors
  FROM `YOUR_PROJECT.YOUR_DATASET.events_table`
  WHERE event = '$exception'
  GROUP BY date, path
)

SELECT
  pv.date, pv.url, pv.path, pv.pageviews, pv.unique_visitors,
  COALESCE(rc.rage_clicks, 0) AS rage_clicks,
  COALESCE(dc.dead_clicks, 0) AS dead_clicks,
  COALESCE(e.errors, 0)       AS errors
FROM pageviews pv
LEFT JOIN rage_clicks rc ON pv.date = rc.date AND pv.path = rc.path
LEFT JOIN dead_clicks dc ON pv.date = dc.date AND pv.path = dc.path
LEFT JOIN errors e       ON pv.date = e.date  AND pv.path = e.path;
Rage clicks and dead clicks only show up if autocapture and the relevant heatmap/click settings are enabled in your PostHog project.
View 4: Traffic sources
Because the sessions table already stores UTM and referrer data, this view needs no regex at all:
CREATE OR REPLACE VIEW `YOUR_PROJECT.YOUR_DATASET.v_traffic_sources` AS

SELECT
  DATE(start_timestamp)            AS date,
  channel_type,
  entry_referring_domain           AS referring_domain,
  entry_utm_source                 AS utm_source,
  entry_utm_medium                 AS utm_medium,
  entry_utm_campaign               AS utm_campaign,
  COUNT(DISTINCT session_id)       AS sessions,
  COUNT(DISTINCT distinct_id)      AS users,
  COUNTIF(is_bounce = 1)           AS bounces,
  ROUND(AVG(session_duration), 1)  AS avg_session_duration_seconds
FROM `YOUR_PROJECT.YOUR_DATASET.sessions_table`
GROUP BY date, channel_type, referring_domain, utm_source, utm_medium, utm_campaign;
View 5: Sessions with errors (for the scorecards)
Looker Studio calculated fields cannot join two data sources, so I pushed the error flag into the session-level view instead:
CREATE OR REPLACE VIEW `YOUR_PROJECT.YOUR_DATASET.v_session_recordings` AS

SELECT
  s.distinct_id                    AS person_id,
  s.session_id,
  DATE(s.start_timestamp)          AS date,
  s.session_duration               AS duration_seconds,
  s.is_bounce,
  s.channel_type,
  s.entry_current_url              AS entry_url,
  s.exit_current_url               AS exit_url,
  COUNTIF(e.event = '$exception')  AS error_count,
  CASE WHEN COUNTIF(e.event = '$exception') > 0 THEN 1 ELSE 0 END AS has_error
FROM `YOUR_PROJECT.YOUR_DATASET.sessions_table` s
LEFT JOIN `YOUR_PROJECT.YOUR_DATASET.events_table` e
  ON REGEXP_EXTRACT(e.properties, r'"\$session_id"\s*:\s*"([^"]+)"') = s.session_id
GROUP BY
  s.distinct_id, s.session_id, date, s.session_duration,
  s.is_bounce, s.channel_type, s.entry_current_url, s.exit_current_url;
Then in Looker Studio create two calculated fields:
- Sessions with errors =
SUM(has_error) - Error rate % =
SUM(has_error) / COUNT(session_id) * 100
Bonus: a funnel chart
PostHog's funnel visualization (Blog visit → Product page → Demo page → Booked a demo) is not something Looker Studio ships natively. You can approximate it by computing each step in SQL, where every step only counts users who completed the previous step after it, and then charting pct_of_start as a bar chart:
WITH step1 AS (
  SELECT distinct_id, MIN(timestamp) AS t1
  FROM `YOUR_PROJECT.YOUR_DATASET.events_table`
  WHERE event = '$pageview'
    AND REGEXP_EXTRACT(properties, r'"\$pathname"\s*:\s*"([^"]+)"') LIKE '%your-blog-slug%'
  GROUP BY distinct_id
),
step2 AS (
  SELECT e.distinct_id, MIN(e.timestamp) AS t2
  FROM `YOUR_PROJECT.YOUR_DATASET.events_table` e
  JOIN step1 s ON e.distinct_id = s.distinct_id
  WHERE e.event = '$pageview'
    AND REGEXP_EXTRACT(e.properties, r'"\$pathname"\s*:\s*"([^"]+)"') LIKE '%product%'
    AND e.timestamp > s.t1
  GROUP BY e.distinct_id
)
SELECT 'Blog visit' AS step, 1 AS step_order, COUNT(*) AS users FROM step1
UNION ALL
SELECT 'Viewed product page', 2, COUNT(*) FROM step2
ORDER BY step_order;
Extend the same pattern for as many steps as you need.
Country and city data is there too
I wondered whether the export included location. It does. PostHog's GeoIP enrichment stores values like $geoip_country_name, $geoip_country_code and $geoip_city_name inside the same properties column, so the same regex trick pulls them out:
SELECT
  REGEXP_EXTRACT(properties, r'"\$geoip_country_name"\s*:\s*"([^"]+)"') AS country,
  REGEXP_EXTRACT(properties, r'"\$geoip_city_name"\s*:\s*"([^"]+)"')    AS city,
  COUNT(*) AS events
FROM `YOUR_PROJECT.YOUR_DATASET.events_table`
WHERE event = '$pageview'
GROUP BY country, city
ORDER BY events DESC;
If this returns empty, check that the GeoIP enrichment is enabled for your project.
What you will not get: age and gender
PostHog is a product analytics tool, not an advertising platform, so it does not collect age or gender. If you need demographics, you have three options: send them yourself as person properties when users sign up (posthog.identify(...)), use GA4's demographic reports alongside PostHog, or pull audience breakdowns from your ad platforms.
Dashboard layout I used
| Page | Charts | Source view |
|---|---|---|
| Web overview | Scorecards (visitors, page views, duration, bounce) plus a daily trend line | v_web_overview |
| Audience and traffic | Channel donut, device bar, top campaigns table | v_audience, v_traffic_sources |
| Conversions | Scorecards plus conversions by action | v_conversions |
| Page analytics | Table with rage clicks, dead clicks, errors per page | v_page_analytics |
| Sessions | Scorecards, duration histogram, entry vs exit pages | v_session_recordings |
Add a date range control on every page. All views expose a date field, so it filters everything consistently.
Does it keep updating?
Yes, with no extra work on your side. A view stores a query, not a copy of the data, so every time Looker Studio loads it, BigQuery reads the current base tables. What actually controls freshness is:
- The PostHog export schedule (hourly or daily).
- Looker Studio's data freshness setting on each data source.
What it costs
For a small site, very little. BigQuery includes a monthly free tier for queries and storage, and a new Google Cloud account comes with trial credits. You can see remaining credit and days under Billing → Overview, and a breakdown by service under Billing → Reports. I recommend setting a budget alert under Billing → Budgets & alerts anyway.
Takeaways
- PostHog connectors such as Windsor.ai and Coupler.io expose metadata objects and raw events, not ready-made web analytics.
- The BigQuery batch export gives you full access, and the sessions model saves you from rebuilding sessions, bounce and channel logic yourself.
- Check column types before converting timestamps.
- For
$-prefixed PostHog properties,REGEXP_EXTRACTis the reliable way to read them from thepropertiescolumn. - Put the logic in BigQuery views and keep Looker Studio simple.
- Age and gender are not available from PostHog; country and city are.
If you are building something similar and get stuck on a specific view, drop a comment and I will help you debug it.
About the author
- A Freelance Dashboard Developer
Comments
Join the discussionNo comments yet. Be the first to comment.